

There are thousands of scientific journals that present research information. Researchers provide unlimited amounts of data from studies that they hope will have an impact on us in some way. With all the information available, it is important that your research stands out. You want to engage the readers. You also want your readers to understand your findings. A good graphics program can help you design graphical abstracts and infographics! It can create powerful illustrations that draw attention to your research and present data in an easily understood format. Mind the Graph is an online graphic design program that specializes in different types of ready-to-use layouts. The program is specifically designed for the science community, including the medical community. It provides tools to create scientific infographics and graphical abstracts that can enable readers within or outside science community to understand research easily.
Features
Mind the Graph offers a host of icons and illustrations for just every subject. These “infographics” will display your data in an organized and visually appealing way.
Some of the advantages of Mind the Graph are as follows:
- High visual impact: Enhance your text by creating eye-catching visuals.
- Relevant icons and illustrations: You can use the online tools to quickly access more than 3,000 illustrations, pictures, and icons that are specific to your subject area.
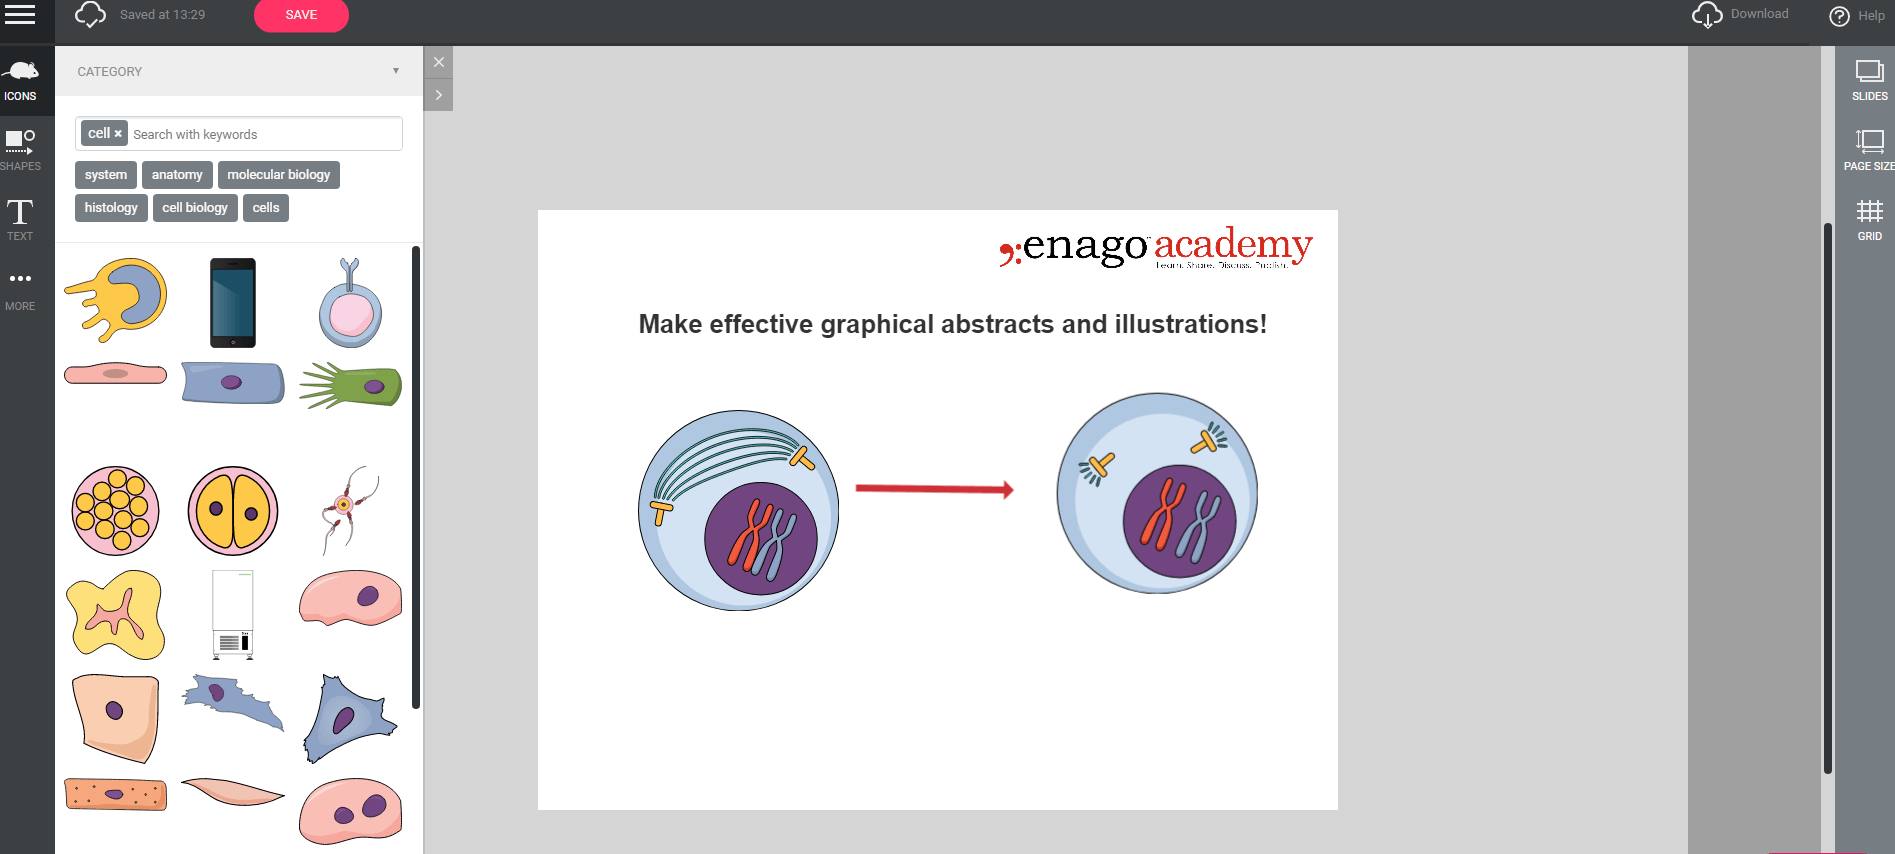
Illustrations and icons relevant to the scientific and medical community
- Image editing available: You can use the tools to easily edit your graphs and illustrations.
- Editable templates. The templates offered can be edited to fit your specific needs.
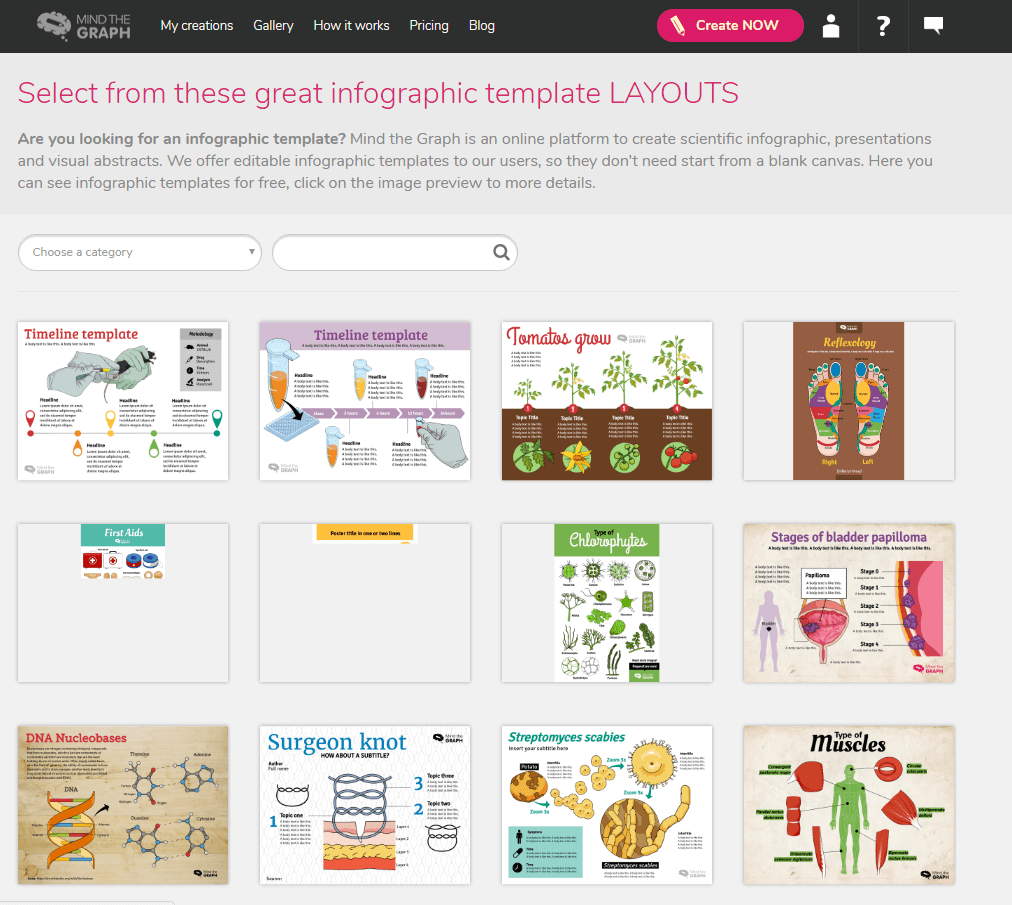
Ready-to-use design templates available in Mind the Graph
- Content geared toward scientific community: Field-specific software will help you create and edit your graphics to create more impactful graphics and figures for your target audience.
- Graphics can be easily updated online. Your creations are automatically saved online so that you can return to them for revisions and updates. You can also make changes to your file and download it.
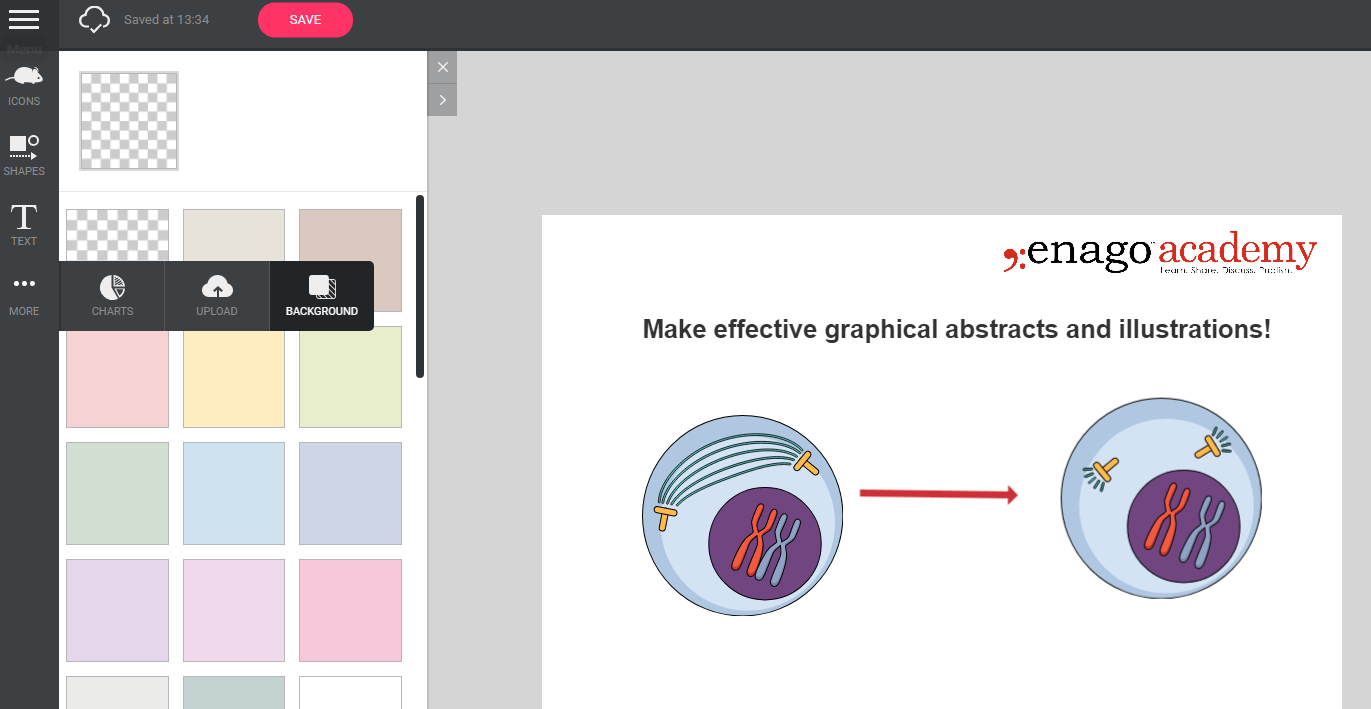
Options to create charts & graphs and upload option to use external icons or illustrations
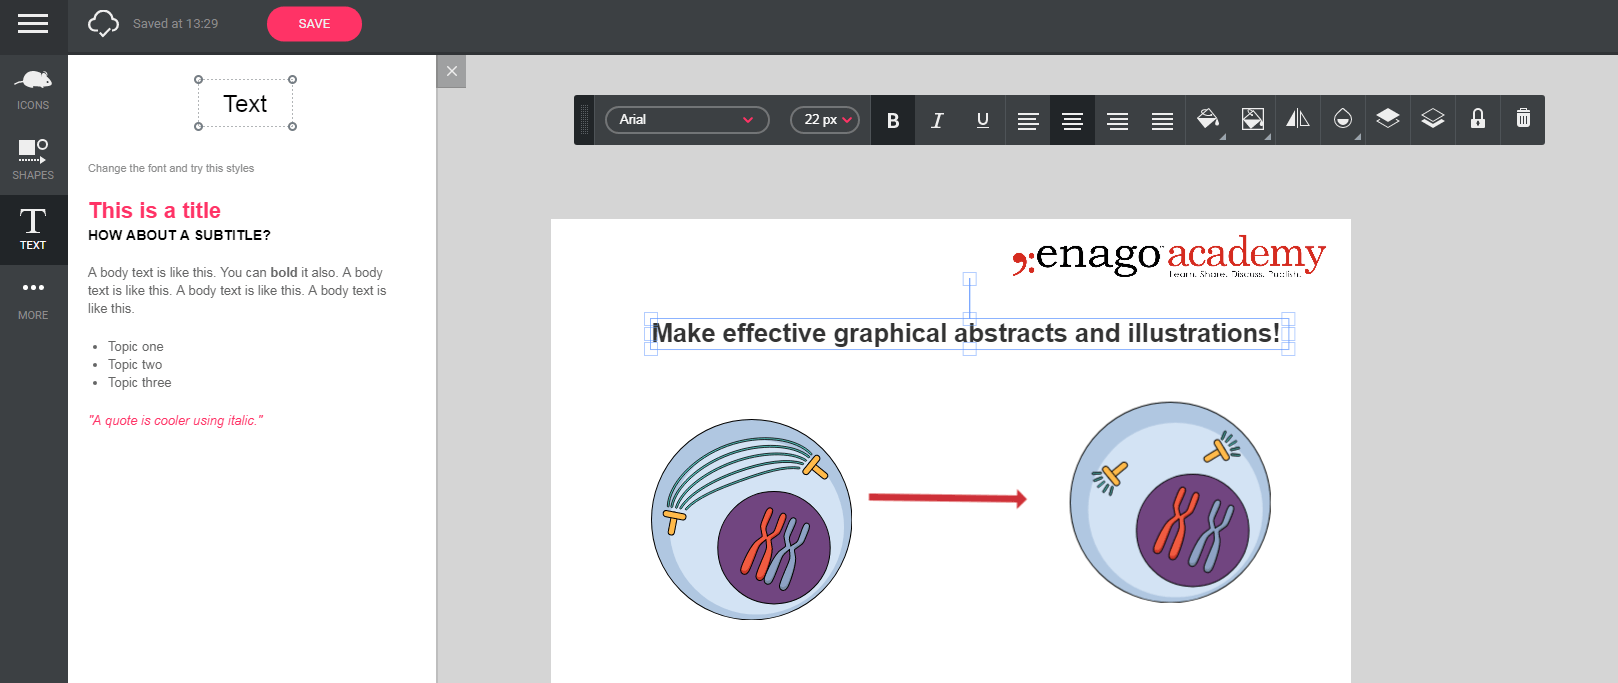
Text editing options available to users in Mind the Graph
- Mind the Graph also allows you to easily share your creation with others. After you have downloaded your graphic, you will see a new pop-up window with instructions for sharing by email or on social media.
- You can choose to represent your data using different graph formats such as bar graphs and radar plots. You can add or delete illustrations and insert headings and other text as needed.
Functionalities
The design functions can be used to create posters, graphical abstracts, and other illustrations using the templates provided. Mind the Graph focuses specifically on scientific writers and researchers. By being more exclusive to this community, it can provide a database of templates for just about every scientific discipline.
You can visit the “Gallery” section of the website to look through the various templates by subject. Any of the templates can be previewed to help you view details. All templates are available for public use under the free Creative Commons license, but keep in mind that Mind the Graph should always be cited in any of your presentations.
Many journals are now offering its researchers the opportunity to provide graphical abstracts instead of text at the beginning of their papers. By doing so, the reader’s interest is immediately piqued. The template gallery offers formats for these as well.
If you are already a Mind the Graph user, we would love to hear about your experience with this exciting tool. Does it make your work with colleagues more effective? Is it easy to use? Which features do you like most? Please feel free to share your thoughts with us by commenting in the section below.